【 研究背景 】
近年來受全球氣候變遷的影響,氣候變異劇烈且頻繁,臺灣極端降雨發生頻率有逐漸升高之趨勢,將影響既有水庫滯洪能力,而提高下游集水區遭受洪水風險。依「水利建造物檢查及安全評估辦法」規定,重要水庫需定期辦理整體安全檢查與評估。水庫安全評估工作項目眾多,針對水庫集水區水文相關分析工作,應包含年最大雨量分析、洪峰流量分析、河道/潰壩洪水演算,以及設計洪水評析等。而現行針對設計洪水評析項目中的「可能最大降水量」與「可能最大洪水量」,目前尚未有明確的計算方式可供參考,因此迫切需要提出解決方案。
【 研究目的 】
本研究目的乃針對示範區域,建置數值高程模式;利用「暴雨移位與露點調整法」、「颱風模式法」、「世界氣象組織統計法」,以及「臺灣最大降雨包絡線經驗公式」,分析示範區域可能最大降水量,而後應用經參數檢定與驗證後之運動波-地貌瞬時單位歷線模式,研發可能最大洪水量估算模式,建置完整分析方法與運算流程;應用地理資訊系統技術整合相關空間資訊,整併研究中所研發的各項地文與水文分析模式,以完成「可能最大洪水量分析模組」架構研擬。
藉由本研究執行成果,期能研發一套便捷的可能最大洪水量分析估算模式,以利評估人員能以最新水文紀錄資料,應用各種可能最大降水量計算方法,以有效率且合理客觀的推估可能最大洪水量,針對影響水庫安全之潛在問題,提出完整的評估資訊。
【 執行成果 】
●颱風模式法(颱風移動設計路徑)
考量形成最大颱風降雨的設計路徑,乃依據集水區地文與水文特性而異,故本研究建議分析步驟修正如下(如圖1):
(1)蒐集歷年造成集水區連續最大N小時降水量之歷史颱風場次,並篩選最大數場歷史颱風;
(2)藉由篩選的歷史颱風,蒐集其颱風中心位置與路徑資料,與其對應集水區的逐時觀測雨量資料;
(3)藉由集水區逐時觀測雨量資料,可得知造成集水區連續最大降水量期間的颱風路徑區段;
(4)藉由歷史颱風路徑,依最小平方法可求得主要設計颱風路徑(如圖1紅色實線)。
【 Research Background 】
Affected by global climate change in recent years, climate variability is severe and frequent, and the frequency of extreme rainfall in Taiwan is gradually increasing, which will affect the flood detention capacity of existing reservoirs and increase the risk of flooding in downstream catchment areas. According to the "Water Conservancy Construction Inspection and Safety Assessment Measures", important reservoirs need to undergo regular overall safety inspections and assessments. There are many items in the reservoir safety assessment work. For the hydrological analysis of the reservoir catchment area, it should include the annual maximum rainfall analysis, flood peak flow analysis, river channel/dam break flood calculation, and design flood analysis. However, there is currently no clear calculation method for the "possible maximum precipitation" and "possible maximum flood" in the design flood evaluation and analysis project, so there is an urgent need to propose a solution.
【 Research purposes 】
The purpose of this study is to build a numerical elevation model for the demonstration area; using the "storm shift and dew point adjustment method", "typhoon model method", "World Meteorological Organization statistical method", and "Taiwan's maximum rainfall envelope empirical formula", Analyze the possible maximum precipitation in the demonstration area, and then apply the kinematic wave-landform instantaneous unit ephemeris model after parameter verification and verification, develop the possible maximum flood estimation model, and establish a complete analysis method and calculation process; apply geographic information system technology integration Relevant spatial information, integrating various geography and hydrology analysis models developed in the research, in order to complete the framework research of the "Maximum Flood Volume Analysis Module".
Based on the results of this study, it is hoped that a set of convenient analysis and estimation models for possible maximum flood volumes can be developed, so that evaluators can use the latest hydrological record data and apply various possible maximum precipitation calculation methods to estimate efficiently and reasonably and objectively The possible maximum flood volume provides complete assessment information for potential problems affecting reservoir safety.
【 Implementation results 】
●Typhoon model method (typhoon movement design path)
Considering the design path of the maximum typhoon rainfall, it varies according to the geography and hydrology characteristics of the catchment area. Therefore, this study proposes to modify the analysis steps as follows (see Figure 1):
(1)Collect the historical typhoon numbers that caused the largest N-hour continuous precipitation in the catchment area over the years, and screen the largest number of historical typhoons;
(2)Based on the selected historical typhoons, the location and track data of the typhoon center and the hourly observed rainfall data of the corresponding catchment area are collected;
(3)By observing rainfall data hourly in the water catchment area, we can know the typhoon track section during the period of continuous maximum precipitation in the water catchment area;
(4)Based on the historical typhoon track, the main design typhoon track can be obtained according to the least square method (red solid line in Figure 1).
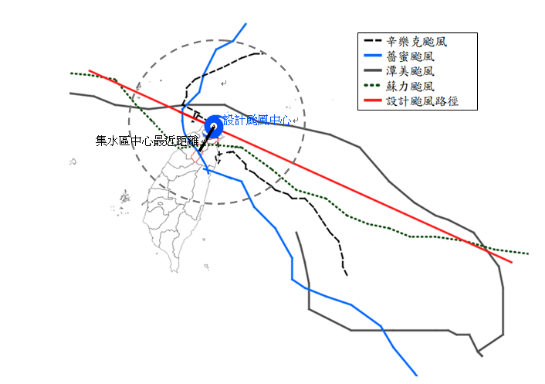
圖1 本研究設計颱風路徑示意圖
Schematic diagram of typhoon track designed in this study
●可能最大降水量分析(臺灣最大年降雨量)
本研究為推求臺灣最大降雨包絡線經驗公式,針對全臺1,246個雨量站,1900年至2019年期間之小時雨量紀錄資料,合計共約163,167,312筆龐大數據資料,經初步統計並繪製臺灣最大年降雨量如圖2所示。由圖可知,1960年後最大累積降雨量有昇高的趨勢,主要可能因早期雨量站多設置於平地(如:臺北站、臺中站,以及花蓮站等),故最大年降雨量較低,而後期各單位則陸續於山區設置雨量站(如:思源橋站、大坪站,以及阿里山站等),故最大年降雨量較高。
●可能最大洪水量分析模組架構研擬
評估人員可利用「颱風模式法」,模擬設計颱風的降雨組體圖,其成果可應用於運動波-地貌瞬時單位歷線模式,進而推估可能最大洪水量。本研究研擬於既有可能最大洪水量分析模組內加入颱風模式法,評估人員可引入颱風模式法模組所計算各延時降雨序列,作為降雨逕流模式的降雨輸入資料。
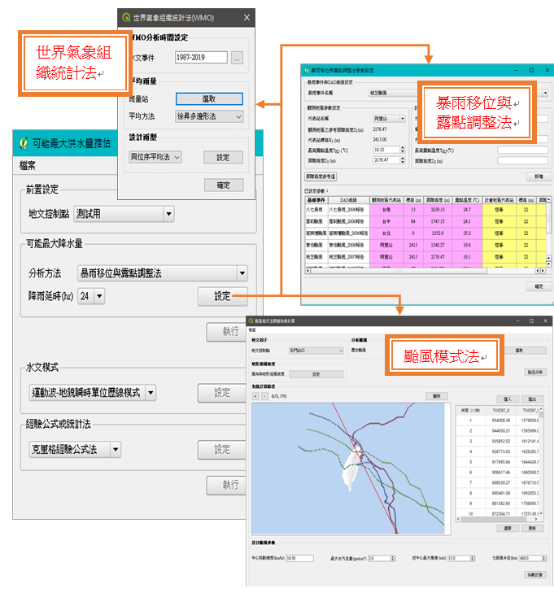
研擬中的可能最大洪水量計算模組視窗介面示意圖如圖3所示,評估人員先決定集水區地文因子後,可透過下拉選單選擇可能最大降水量的分析方法,可選擇「暴雨移位與露點調整法」、「世界氣象組織統計法(WMO)」,以及本研究所開發的「颱風模式法」。計算可能最大降水量後,可設定運動波-地貌瞬時單位歷線降雨逕流模式參數進而推估可能最大洪水量。
●Analysis of possible maximum precipitation (Taiwan maximum annual rainfall)
This research is to deduce the empirical formula of the maximum rainfall envelope in Taiwan. Based on the hourly rainfall records of 1,246 rainfall stations in Taiwan from 1900 to 2019, a total of about 163,167,312 huge data, preliminary statistics and drawing of the maximum annual rainfall in Taiwan The amount is shown in Figure 2. It can be seen from the figure that the maximum cumulative rainfall tends to increase after 1960, mainly because the early rainfall stations were mostly located on flat ground (such as Taipei Station, Taichung Station, and Hualien Station, etc.), so the maximum annual rainfall was low. In the later period, various units successively set up rainfall stations in mountainous areas (such as Siyuanqiao Station, Daping Station, and Alishan Station, etc.), so the maximum annual rainfall is relatively high.
●Research on the possible maximum flood volume analysis module architecture
Evaluators can use the "typhoon model method" to simulate and design typhoon rainfall group maps, and the results can be applied to the kinematic wave-landform instantaneous unit history model, and then estimate the possible maximum flood volume. This study proposes to add the typhoon model method to the analysis module of the maximum possible flood volume. Evaluators can introduce the time-delayed rainfall series calculated by the typhoon model method module as the rainfall input data of the rainfall runoff model.
The window interface diagram of the possible maximum flood volume calculation module under research is shown in Figure 3. After determining the geographical factors of the catchment area, the evaluator can select the analysis method of the possible maximum precipitation volume through the drop-down menu. Position and dew point adjustment method", "World Meteorological Organization (WMO)" method, and "typhoon model method" developed by this research institute. After calculating the possible maximum precipitation, the parameters of the kinematic wave-landform instantaneous unit annals rainfall-runoff model can be set to estimate the possible maximum flood.
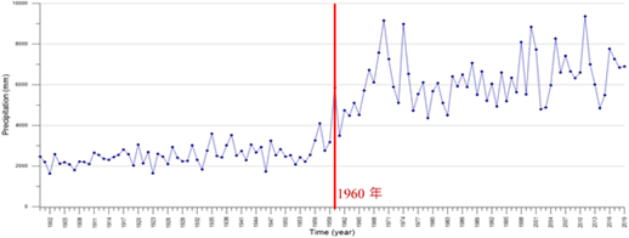
圖2 全臺雨量站最大年雨量分析(1900年~2019年紀錄)
Analysis of the maximum annual rainfall of rainfall stations in Taiwan (records from 1900 to 2019)
圖3 可能最大洪水量計算模組使用者介面示意圖
Schematic diagram of the user interface of the possible maximum flood calculation module