【 研究背景 】
臺灣人口稠密且工商業快速發展,水資源建設更為提昇國民生活品質與促進社會經濟發展之基礎。近年來,水資源分配與管理議題隨著全球氣候異常而逐年受到重視,而臺灣亦持續面臨著劇烈且不穩定的天氣型態,迫使政府需務實面對各種複合型災害之嚴峻挑戰,因此需發展智慧水資源管理策略,強化區域供水調度能力,且以跨流域整合新思維,有效地進行水資源應用與調配管理作業,藉此提升抗旱韌性及水資源供需效能。
【 研究目的 】
本計畫利用前期計畫之研究成果,以定率水文觀點建置各流域地形指數日流量模式,應用網際網路地理資訊系統(Web-GIS)技術,自動介接中央氣象局所發布長期天氣展望資料及水利署發布的河川、水庫等流量資料及各項水資源分析工具,擴充建置水源運用分析系統與流量推估模組。可針對中央管河川流域流量站、水庫壩堰位置等重要控制點,提供河川流量及翡翠、石門、寶二、鯉魚潭、曾文、牡丹、阿公店水庫入流量預測等資訊,並透過Web-GIS網頁瀏覽器,供使用者進行成果檢視與查詢,可迅速支援決策者進行河川與水庫入流量預測,以達水資源最適調配與評估目的。
【 執行成果 】
●水源運用分析系統架構
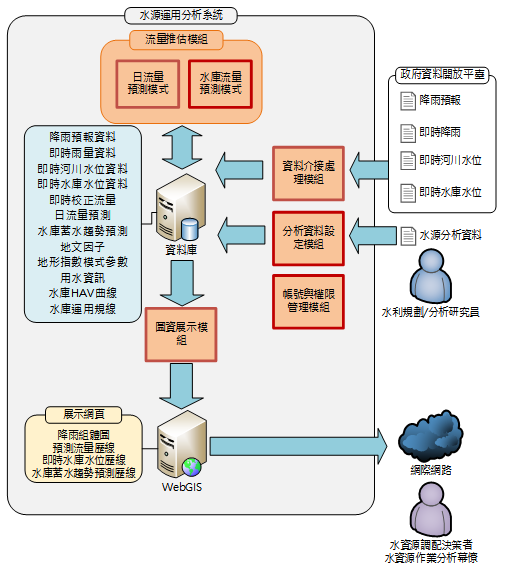
本計畫利用Web-GIS技術建置完整之「水源運用分析系統」網頁瀏覽器,輔以前期規劃作業平台之分析結果,進行流量推估模組功能建置與擴充。該系統主要由資料庫系統、網頁系統(Web-GIS)與數個功能模組所組成(如圖1)。資料庫系統負責儲存分析系統所需之紀錄資料,網頁系統則提供Web-GIS之架設平台,各功能模組則依系統需求處理資料或管理系統。
【 Research Background 】
Taiwan has a dense population and rapid development of industry and commerce. The construction of water resources is the basis for improving the quality of life of the people and promoting social and economic development. In recent years, the issue of water resource allocation and management has been paid more and more attention year by year due to global climate anomalies, and Taiwan is also constantly facing severe and unstable weather patterns, forcing the government to face the severe challenges of various complex disasters pragmatically. Therefore, it is necessary to Develop smart water resource management strategies, strengthen regional water supply dispatching capabilities, and use cross-basin integration of new thinking to effectively carry out water resource application and allocation management operations, thereby improving drought resilience and water resource supply and demand efficiency.
【 Research purposes 】
This project uses the research results of the previous project to build the daily flow model of the topographic index of each watershed from the viewpoint of constant rate hydrology, and uses Internet Geographic Information System (Web-GIS) technology to automatically interface with the long-term weather forecast data released by the Central Meteorological Bureau. And the flow data of rivers and reservoirs issued by the Water Resources Department and various water resource analysis tools, expand and build water source utilization analysis systems and flow estimation modules. For important control points such as centrally managed river basin flow stations and the location of reservoir dams and weirs, it can provide information such as river flow and inflow forecasts for Feicui, Shimen, Baoer, Liyutan, Zengwen, Mudan, and Agongdian reservoirs, and through Web- The GIS web browser is for users to view and query the results, and can quickly support decision makers in predicting the inflow of rivers and reservoirs, so as to achieve the purpose of optimal allocation and evaluation of water resources.
【 Implementation results 】
●Water source utilization analysis system architecture
This project uses Web-GIS technology to build a complete "water source utilization analysis system" web browser, supplemented by the analysis results of the pre-planning operation platform, and builds and expands the functions of the flow estimation module. The system is mainly composed of a database system, a web page system (Web-GIS) and several functional modules (as shown in Figure 1). The database system is responsible for storing the record data required by the analysis system, the webpage system provides the platform for setting up Web-GIS, and each functional module processes data or manages the system according to system requirements.
圖1 水源運用分析系統架構
Water source utilization analysis system architecture
●網頁展示介面
Web-GIS整合系統內的靜態圖資與圖資展示模組輸入之數據資料,再透過網頁系統進行各項圖資之展示,供使用者能快速查詢目前水文資訊。「水源運用分析系統」(如圖2)之展示資訊主要分為4類,包括:(1)水庫水情摘要、(2)水情預測查詢、(3)歷史流量分析,以及(4)常用圖資選用。各展示資訊頁面之說明如下:
(1)水庫水情摘要:展示內容主要為水庫流量相關圖表資訊,如水庫紀錄流量、未來預測流量、現況水位、蓄水量、未來預測蓄水量等模式分析演算資訊。
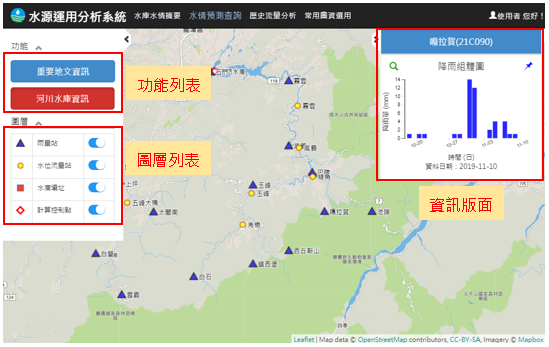
(2)水情預測查詢(如圖3):主要針對計畫中各水庫相關流域之水文測站及重要控制點,展示重要地文資訊與各項介接完成之即時水文資訊。
(3)歷史流量分析:展示內容主要為利用流域內水位站歷史紀錄,所分析之圖表資訊,如日流量延時曲線、月平均流量、豐水期與枯水期間流量及超越機率資訊等模式分析演算資訊。
(4)常用圖資選用:使用者可針對「地圖模式瀏覽」的資訊圖表進行釘選,當使用者釘選各式欲關注的圖表後,即可快速於本頁籤集中查看圖表,方便使用者進行圖表比對、閱讀。
●Web display interface
Web-GIS integrates the static maps in the system and the data input by the map display module, and then displays various maps through the web system, so that users can quickly query the current hydrological information. The display information of the "Water Source Utilization Analysis System" (as shown in Figure 2) is mainly divided into 4 categories, including: (1) Reservoir water regime summary, (2) Water regime forecast query, (3) Historical flow analysis, and (4) Commonly used Graphic materials selection. The description of each display information page is as follows:
(1)Summary of Reservoir Water Conditions: The displayed content mainly includes information related to reservoir flow charts, such as reservoir record flow, future forecast flow, current water level, water storage capacity, future forecast water storage capacity, and other model analysis and calculation information.
(2)Water regime forecast query (as shown in Figure 3): mainly for the hydrometric stations and important control points in the relevant watersheds of the reservoirs in the plan, display important geography information and real-time hydrology information after various interfaces are completed.
(3)Historical flow analysis: The display content mainly uses the historical records of the water level stations in the basin to analyze the chart information, such as the daily flow delay curve, monthly average flow, flow during wet and dry periods, and information on exceeding probability.
(4)Selection of commonly used graphs: users can pin the infographics in the "Map Mode Browsing". After the user pins all kinds of graphs that he wants to pay attention to, he can quickly view the graphs in this tab, which is convenient for users to view graphs. Compare and read.
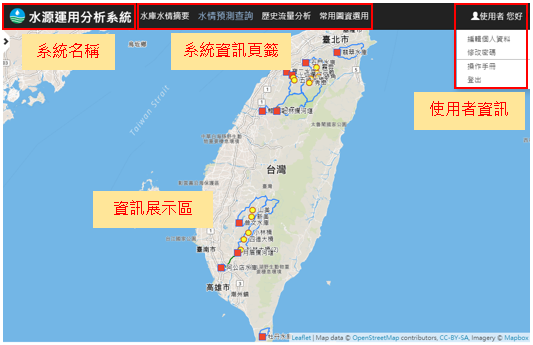
圖2 系統畫面示意圖
System Screen Diagram
圖3 「水情預測查詢」展示畫面示意
"Water Regime Forecast Query" display screen